Last reviewed: October 25, 2026. Figures come from the U.S. Helicopter Safety Team (USHST) newsletters for fall 2025 and spring 2026, and from an FAA blog post about the team, each retrieved on the date shown. Accident data are reported with estimates, and later reports can revise them. This guide does not make safety claims beyond what those sources state, and it names no individual accident.
Anyone considering helicopter training eventually asks whether the work is dangerous. A fair answer starts with what the data measure and what they leave out. This guide summarizes the most recent published U.S. figures, explains how to read the rates and lists what students can do with the information.
Quick answerFor fiscal year 2025, the USHST reported 96 U.S. helicopter accidents, 20 of them fatal, with 41 fatalities. It estimated an accident rate of 3.18 per 100,000 flight hours and a fatal accident rate of 0.66 per 100,000 flight hours. The team said the accident count and rate were the lowest of any fiscal year in its 43 years of records (USHST Fall 2025 newsletter, retrieved Oct. 25, 2026). Rates differ by type of flying, and the numbers say little about an individual student's risk.
Where the numbers come from
The USHST is a government-industry partnership focused on reducing helicopter accidents and fatalities in the United States, established in 2013 (FAA, "Say 'Helo' to the USHST," retrieved Oct. 25, 2026). It is made up of volunteers from helicopter manufacturers, flight schools, the FAA, the NTSB and industry groups, led by Vertical Aviation International (USHST newsletters). It publishes monthly and fiscal-year summaries.
For its fatal accident rates, the USHST says it counts accidents involving U.S.-registered aircraft operating in the U.S. and its territories (including offshore) that are not public aircraft (USHST Fall 2025 newsletter). That definition matters when comparing with other sources, which may count differently.
The most recent full year: fiscal year 2025
| Measure |
FY25 (USHST) |
| Accidents (fatal and non-fatal) |
96 |
| Fatal accidents |
20 |
| Fatalities |
41 |
| Estimated accident rate |
3.18 per 100,000 flight hours |
| Estimated fatal accident rate |
0.66 per 100,000 flight hours |
| Estimated fatality rate |
1.36 per 100,000 flight hours |
| Share of rotorcraft accidents with a fatality |
21% |
Source: USHST Fall 2025 e-newsletter, retrieved Oct. 25, 2026. The team reported the FY25 accident count and rate as the lowest of any fiscal year in the 43 years on record. It also reported that the FY25 fatal accident rate was 22 percent higher than the same period in FY24 and 4 percent lower than the five-year average. Both statements are true at once: totals for all accidents fell while the fatal rate rose against the prior year.
The current year so far: fiscal year 2026 (October to April)
The spring 2026 newsletter reports FY26 results through April (USHST, retrieved Oct. 25, 2026):
- 41 accidents, 11 fatal accidents and 21 fatalities.
- An estimated accident rate of 2.41 per 100,000 flight hours, 19 percent lower than the same period in FY25.
- An estimated fatal accident rate of 0.65 per 100,000 flight hours, 18 percent lower than the same period in FY25.
- Through seven months, 27 percent of rotorcraft accidents in FY26 had a fatality, against a long-term historical share of 17 to 18 percent.
These are partial-year figures and will change. Because counts are small, a few events can move a percentage noticeably.
Where accidents happen: by type of flying
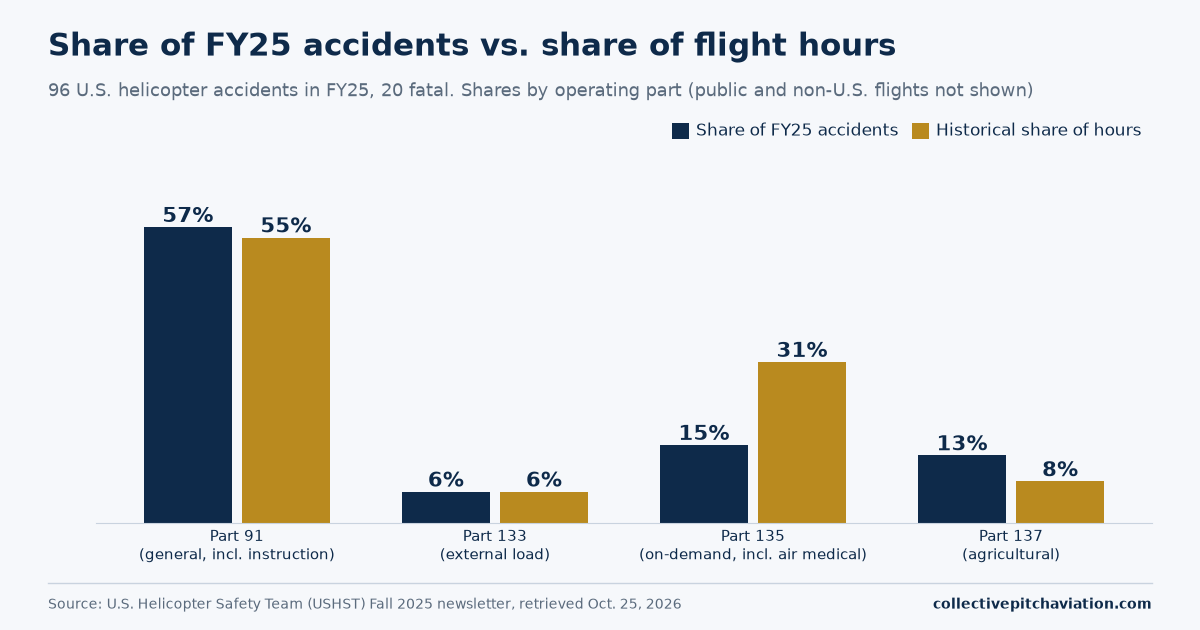
The USHST breaks accidents down by the part of the federal regulations under which the flight was operated. For FY25, it compared each part's share of accidents with its historical share of flight hours:
| Operating part (what it generally covers) |
Share of FY25 accidents |
Historical share of flight hours |
| Part 91 (general operations, including private and instructional flying) |
57% |
55% |
| Part 133 (external load work) |
6% |
6% |
| Part 135 (commuter and on-demand operations, which include air medical and tours) |
15% |
31% |
| Part 137 (agricultural aircraft operations) |
13% |
8% |
Source: USHST Fall 2025 e-newsletter. Remaining accidents were public aircraft (3%) or flown outside the U.S. (6%), and flight hours are unknown for those. The descriptions in the left column are our summaries of the regulation parts, not USHST wording.
By sector, the largest share of FY25 accidents was personal and private flying (34 percent, 32 events). Aerial application and helicopter air ambulance were tied at 13 percent each. For FY26 through April, personal and private flying was again the largest share of accidents (39 percent), followed by helicopter air ambulance (17 percent) and aerial observation (12 percent). The newsletter lists instructional and training flying as one of several sectors with 9 percent of FY26 fatal accidents so far, which is one accident of the 11 (USHST Spring 2026 newsletter).
Reading a table like this takes care. A sector's share of accidents does not say how likely an accident is on a given flight, because sectors fly very different numbers of hours. The Part 135 line above shows this: 15 percent of accidents against 31 percent of historical hours suggests a lower accident share than hours share, while Part 137 is the opposite. Even these comparisons mix different kinds of operations, so avoid drawing conclusions about a single job.
The team's five-year goals
The USHST tracks five-year average fatal accident rates per 100,000 hours by operating part. Its published baseline (2018 to 2022), goal (2025 to 2029) and progress (2021 to 2025) are:
| Part |
Baseline |
Goal |
Progress |
| 91 |
0.81 |
0.73 |
0.59 |
| 133 |
1.73 |
1.56 |
0.61 |
| 135 |
0.33 |
0.17 |
0.34 |
| 137 |
1.11 |
1.00 |
1.45 |
Source: USHST Fall 2025 e-newsletter. By these figures, Parts 91 and 133 sit below their goal rates and Parts 135 and 137 sit above theirs (our reading of the table). The table is the team's own tracking, so use it to see where the group is focusing, not to rank the safety of jobs.
What the data cannot tell you
- Your personal risk. Rates describe a population of flights, not an individual. Training, judgment, maintenance, weather and the operator all matter, and the sources reviewed do not quantify them.
- A single career track. The USHST data cover all operations. They do not tell you the risk of becoming, for example, an EMS pilot. For career context, see EMS pilot requirements and job tracks.
- Cause. Counts and rates do not explain why accidents happen. The team uses data from the FAA's Rotorcraft Issue Analysis Team and other sources to study causes (FAA blog, retrieved Oct. 25, 2026).
- Flight hours. Rates use estimated flight hours, so they are estimates.
- Comparisons with other transport. We found no primary source in this review that compares helicopter rates to other modes using the same definitions, so we make no such comparison.
The FAA blog says the USHST's earlier work produced resources such as flight data monitoring and the "56 Seconds to Live" campaign, a video series and free training course on recognizing and avoiding spatial disorientation and unintended flight into instrument weather conditions. It lists new efforts under development on conservative go/no-go decision making, low altitude hazards such as wires and towers, risk management for night operations and fatigue risk (FAA, "Say 'Helo' to the USHST," retrieved Oct. 25, 2026). The USHST also provides a confidential peer support program for pilots and crew members, according to the same post.
- Ask schools about safety culture. Ask how they handle weather decisions, maintenance and flight reviews. See our school criteria and training stages guide.
- Learn the free resources. The FAA post points to the USHST's training course and safety materials.
- Plan for medical and training standards. See requirements.
- Read primary sources. Check the USHST newsletters and NTSB reports yourself, because summaries on websites can differ from the originals.
- Decide with your own information. This site cannot say whether the risk is right for you.
Frequently asked questions
How many helicopter accidents happen each year in the U.S.?
The USHST reported 96 accidents in fiscal year 2025, including 20 fatal accidents (USHST Fall 2025 newsletter). That count was the lowest of any fiscal year in its records.
What is the helicopter fatal accident rate?
The USHST estimated 0.66 per 100,000 flight hours for FY25 and 0.65 for October through April of FY26.
Is helicopter flying dangerous?
The data show accidents occur and vary by type of flying. They do not tell any one person whether the risk is acceptable. Compare rates by operating part and weigh them with your own judgment.
Which type of helicopter flying has the most accidents?
By count, personal and private flying had the largest share in FY25 and FY26 so far. That does not say it has the highest rate.
Are training flights included?
Instructional and training flying is one of the sectors the USHST tracks. It was listed with 9 percent of FY26 fatal accidents through April, which is one accident (USHST Spring 2026 newsletter).
Where can you read the original reports?
USHST newsletters are published at ushst.org, and the NTSB investigates civil aviation accidents. Check the date on any figure.
Sources
- U.S. Helicopter Safety Team, Fall 2025 e-newsletter (FY25 summary, five-year goals). https://ushst.org/ushst-fall-2025-enewsletter-intro/. Retrieved October 25, 2026.
- U.S. Helicopter Safety Team, Spring 2026 e-newsletter (FY26 through April). https://ushst.org/welcome-to-the-spring-2026-us-helicopter-safety-team-e-newsletter/. Retrieved October 25, 2026.
- Federal Aviation Administration, "Say 'Helo' to the USHST." https://www.faa.gov/blog/clearedfortakeoff/say-helo-ushst. Retrieved October 25, 2026.
Disclosure: this page may show ads. See our advertising and affiliate disclosure. This is general information, not safety, medical or career advice.